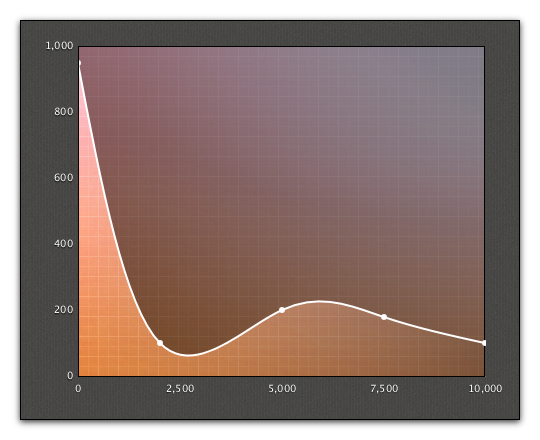
I was experimenting today with extending AreaChart to do curve fitting for some example code I was hacking on. It is also a example of what can be done with styling JavaFX charts with CSS. Here is the result:
Curve Fitting
I have to admit I did not work out all the Math myself for the curve fitting I found a great article on CodeProject “Draw a Smooth Curve through a Set of 2D Points with Bezier Primitives”. Then ported the code to Java from C# and wired it up to our AreaChart. My version is not the most efficient as we do not yet have the correct API hooks to make it easy but we are thinking about how to add them. The current implementation extends AreaChart and overrides the layoutPlotChildren() method. That method creates all the nodes need for the chart and populates the node properties of the Series and Data items. So I can call super to let the standard code do its job then look at the Path elements for the stroked Path and filled Path that make up the AreaChart. I can then replace the LineTo elements with CubicCurveTo with the new control points calculated with the maths from the article. This way everything like auto ranging and animation still works as expected. The only waste is we are creating all the LineTo object and then throwing them away to replace them with CubicCurveTo objects. So here is the code that does this:
    /** @inheritDoc */
    @Override protected void layoutPlotChildren() {
        super.layoutPlotChildren();
        for (int seriesIndex=0; seriesIndex < getDataSize(); seriesIndex++) {
            final XYChart.Series<Number, Number> series = getData().get(seriesIndex);
            final Path seriesLine = (Path)((Group)series.getNode()).getChildren().get(1);
            final Path fillPath = (Path)((Group)series.getNode()).getChildren().get(0);
            smooth(seriesLine.getElements(), fillPath.getElements());
        }
    }

    private int getDataSize() {
        final ObservableList<XYChart.Series<Number, Number>> data = getData();
        return (data!=null) ? data.size() : 0;
    }

    private static void smooth(ObservableList<PathElement> strokeElements, ObservableList<PathElement> fillElements) {
        // as we do not have direct access to the data, first recreate the list of all the data points we have
        final Point2D[] dataPoints = new Point2D[strokeElements.size()];
        for (int i = 0; i < strokeElements.size(); i++) {
            final PathElement element = strokeElements.get(i);
            if (element instanceof MoveTo) {
                final MoveTo move = (MoveTo)element;
                dataPoints[i] = new Point2D(move.getX(), move.getY());
            } else if (element instanceof LineTo) {
                final LineTo line = (LineTo)element;
                final double x = line.getX(), y = line.getY();
                dataPoints[i] = new Point2D(x, y);
            }
        }
        // next we need to know the zero Y value
        final double zeroY = ((MoveTo) fillElements.get(0)).getY();

        // now clear and rebuild elements
        strokeElements.clear();
        fillElements.clear();
        Pair<Point2D[], Point2D[]> result = calcCurveControlPoints(dataPoints);
        Point2D[] firstControlPoints = result.getKey();
        Point2D[] secondControlPoints = result.getValue();
        // start both paths
        strokeElements.add(new MoveTo(dataPoints[0].getX(),dataPoints[0].getY()));
        fillElements.add(new MoveTo(dataPoints[0].getX(),zeroY));
        fillElements.add(new LineTo(dataPoints[0].getX(),dataPoints[0].getY()));
        // add curves
        for (int i = 1; i < dataPoints.length; i++) {
            final int ci = i-1;
            strokeElements.add(new CubicCurveTo(
                    firstControlPoints[ci].getX(),firstControlPoints[ci].getY(),
                    secondControlPoints[ci].getX(),secondControlPoints[ci].getY(),
                    dataPoints[i].getX(),dataPoints[i].getY()));
            fillElements.add(new CubicCurveTo(
                    firstControlPoints[ci].getX(),firstControlPoints[ci].getY(),
                    secondControlPoints[ci].getX(),secondControlPoints[ci].getY(),
                    dataPoints[i].getX(),dataPoints[i].getY()));
        }
        // end the paths
        fillElements.add(new LineTo(dataPoints[dataPoints.length-1].getX(),zeroY));
        fillElements.add(new ClosePath());
    }
CSS Styling
This is just the standard AreaChart in terms of the nodes its drawing with. The first part of the CSS is styling the main chart node and its background. We are using a dark gray texture as the background, adding a 1px black border and a drop shadow. Also adjusting the padding a little.
.chart {
    -fx-background-image: url("background.png");
    -fx-padding: 15 25 15 15;
    -fx-border-color: black;
    -fx-effect: dropshadow( gaussian , rgba(0,0,0,0.8) , 10, 0.0 , 0 , 2 );
}
Next we are looking at the background of the plot area, this is the rectangular area bordered by the two axis. We are using two background images here one a colored glow and the second is transparent white gridlines. The first image is sized to “cover” the whole area of the plot background and the second is tiled to fill. We also add black borders to the top and right to complete a box around the plot area including the two axis lines.
.chart-plot-background {
    -fx-background-image: url("chart-background.png"), url("graph-gridlines.png");
    -fx-background-size: cover, auto;
    -fx-background-repeat: no-repeat, repeat;
    -fx-background-position: 0% 0%, 0% 100%;
    -fx-border-color: black black transparent transparent;
}
The line that connects the data points we are styling to be 2px wide and white.
.chart-series-area-line {
    -fx-stroke: white;
    -fx-stroke-width: 2px;
}
The filled area under the line we are styling with a linear gradient from white on the left to 100% transparent white on the right. We also use a blend mode to get the desired effect when blending with the colored background of the plot area.
.chart-series-area-fill {
    -fx-fill: linear-gradient(to right, white, rgba(255,255,255,0));
    -fx-blend-mode: OVERLAY;
}
Making the plot symbols for each data point white.
.chart-area-symbol {
    -fx-background-color: white;
}
Hiding the tick marks and changing the color of the axis lines to black
.axis {
    -fx-tick-mark-visible: false;
    -fx-minor-tick-visible: false;
    -fx-tick-length: 3;
    -fx-minor-tick-length: 0;
    -fx-border-color: transparent;
}
.axis:bottom {
    -fx-border-color: black transparent transparent transparent;
}
.axis:left {
    -fx-border-color: transparent black transparent transparent;
}
Styling the text labels on the axis so they are white with black shadow and a little larger than default.
.axis Text{
    -fx-fill: white;
}
.tick-mark {
    -fx-font-size: 10px;
    -fx-effect: dropshadow( one-pass-box , rgba(0,0,0,0.8) , 0, 0.0 , 0 , 1 );
}
There you go that is all you need to take one of our standard charts and make it look completely different. Hopefully this will inspire some of you to try some exciting designs with JavaFX charts.
Source Code
The full Netbeans project and code including the maths is available here (CurveFittedChart.zip).

Very good!! nice work!
There seems to be a problem with the deployment. I am using chrome, I had to set “always run java vm for this site”, and then hit refresh button to make the example run. Only setting “always run java vm for this site” isn’t enough.
If I set “only run JVM this time” it doesn’t work.
same for me under Chrome
in FF it is working fine
now checked again…the applet works in both Chrome and FF – great!
This particular sample looks great. But highly resource hungry.
Circa 8-10% of i5-2500 core and 60-70 MB of memory.
And sorry for stupid question… – in attached project no animation at all?
How does it pretty bounce?
Sorry hacked on the code after I posted the zip. The animation is built into standard JavaFX Charts. All I did was change the data randomly over time. Here is the code to add at the bottom of the start() method:
[java]
// Change the data over time to represent real live data
Timeline dataModification = new Timeline();
dataModification.setCycleCount(Timeline.INDEFINITE);
dataModification.getKeyFrames().setAll(new KeyFrame(Duration.millis(500), new EventHandler<ActionEvent>() {
Random r = new Random();
@Override public void handle(ActionEvent arg0) {
ObservableList<XYChart.Data<Number, Number>> data = series.getData();
int dataIndex = r.nextInt(data.size());
XYChart.Data<Number, Number> dataItem = data.get(dataIndex);
dataItem.setYValue(Math.min(Math.max(dataItem.getYValue().intValue() + r.nextInt(200) – 100, 100), 1000));
}
}));
dataModification.play();
[/java]
Resource wise, not sure why the heavy memory use, is that heap space or the complete Java process?
CPU wise I am sure there are ways to optimize this was just quickly put together for a demo.
2Jasper
Thanks for answer.
Complete Java process consumed circa 65 MB, though it is not terrible.
But strong CPU-power demand needs further investigation…
Why not to use jHepWork Java classes for curve fitting?
Here are examples:
http://jwork.org/jhepwork/examples/Fitting/
http://jwork.org/jhepwork/wikidoc/doku.php?id=public:fitting
Wait, what is the Timeline class in the comment?
Have you added it to the project after posting the code?
Great Effort,
but when i try to change the class to extend LineChart
i get a RuntimeException
Caused by: java.lang.ClassCastException: javafx.scene.shape.Path cannot be cast to javafx.scene.Group at CurvedFittedAreaChart.layoutPlotChildren(CurvedFittedAreaChart.java:28)
any comments ?
Great job,
I`ve try use your smooth line area chart with a line chart, I have a problem with cast exception in here:
final Path seriesLine = (Path)((Group)series.getNode()).getChildren().get(1);
final Path fillPath = (Path)((Group)series.getNode()).getChildren().get(0);
I’ve change the extended class to LineChart …
you have any idea how to fix, to have a smooth line with line chart??
Cheers
Group canno’t be cast with Path
I use your code in one of my projects (https://github.com/fge/grappa-debugger) and I love it! Still not standard in JavaFX as of 8 AFAICS, and I wonder why 🙁
I’ve recently written a post on trend curves in JavaFX charts. It takes a different approach, but you may find it interesting.
You can find it here.
There is an issue with the graph. For example if we try to build a line through the points (2,2) (6,6) and (12,7) (**hence not starting from origin 0) there is an extension of the graph from the initial point (in our case (2,2)). The line graph does not start at (2,2) but lets say (1.5, 1.75). Any idea how to fix this?